Operations Automation Pipeline
Logistics & Operations
Overview
Operations team spent 10+ hours weekly pulling data from multiple systems, combining in Excel, and distributing reports. Process was error-prone and didn't scale with business growth.
My Role
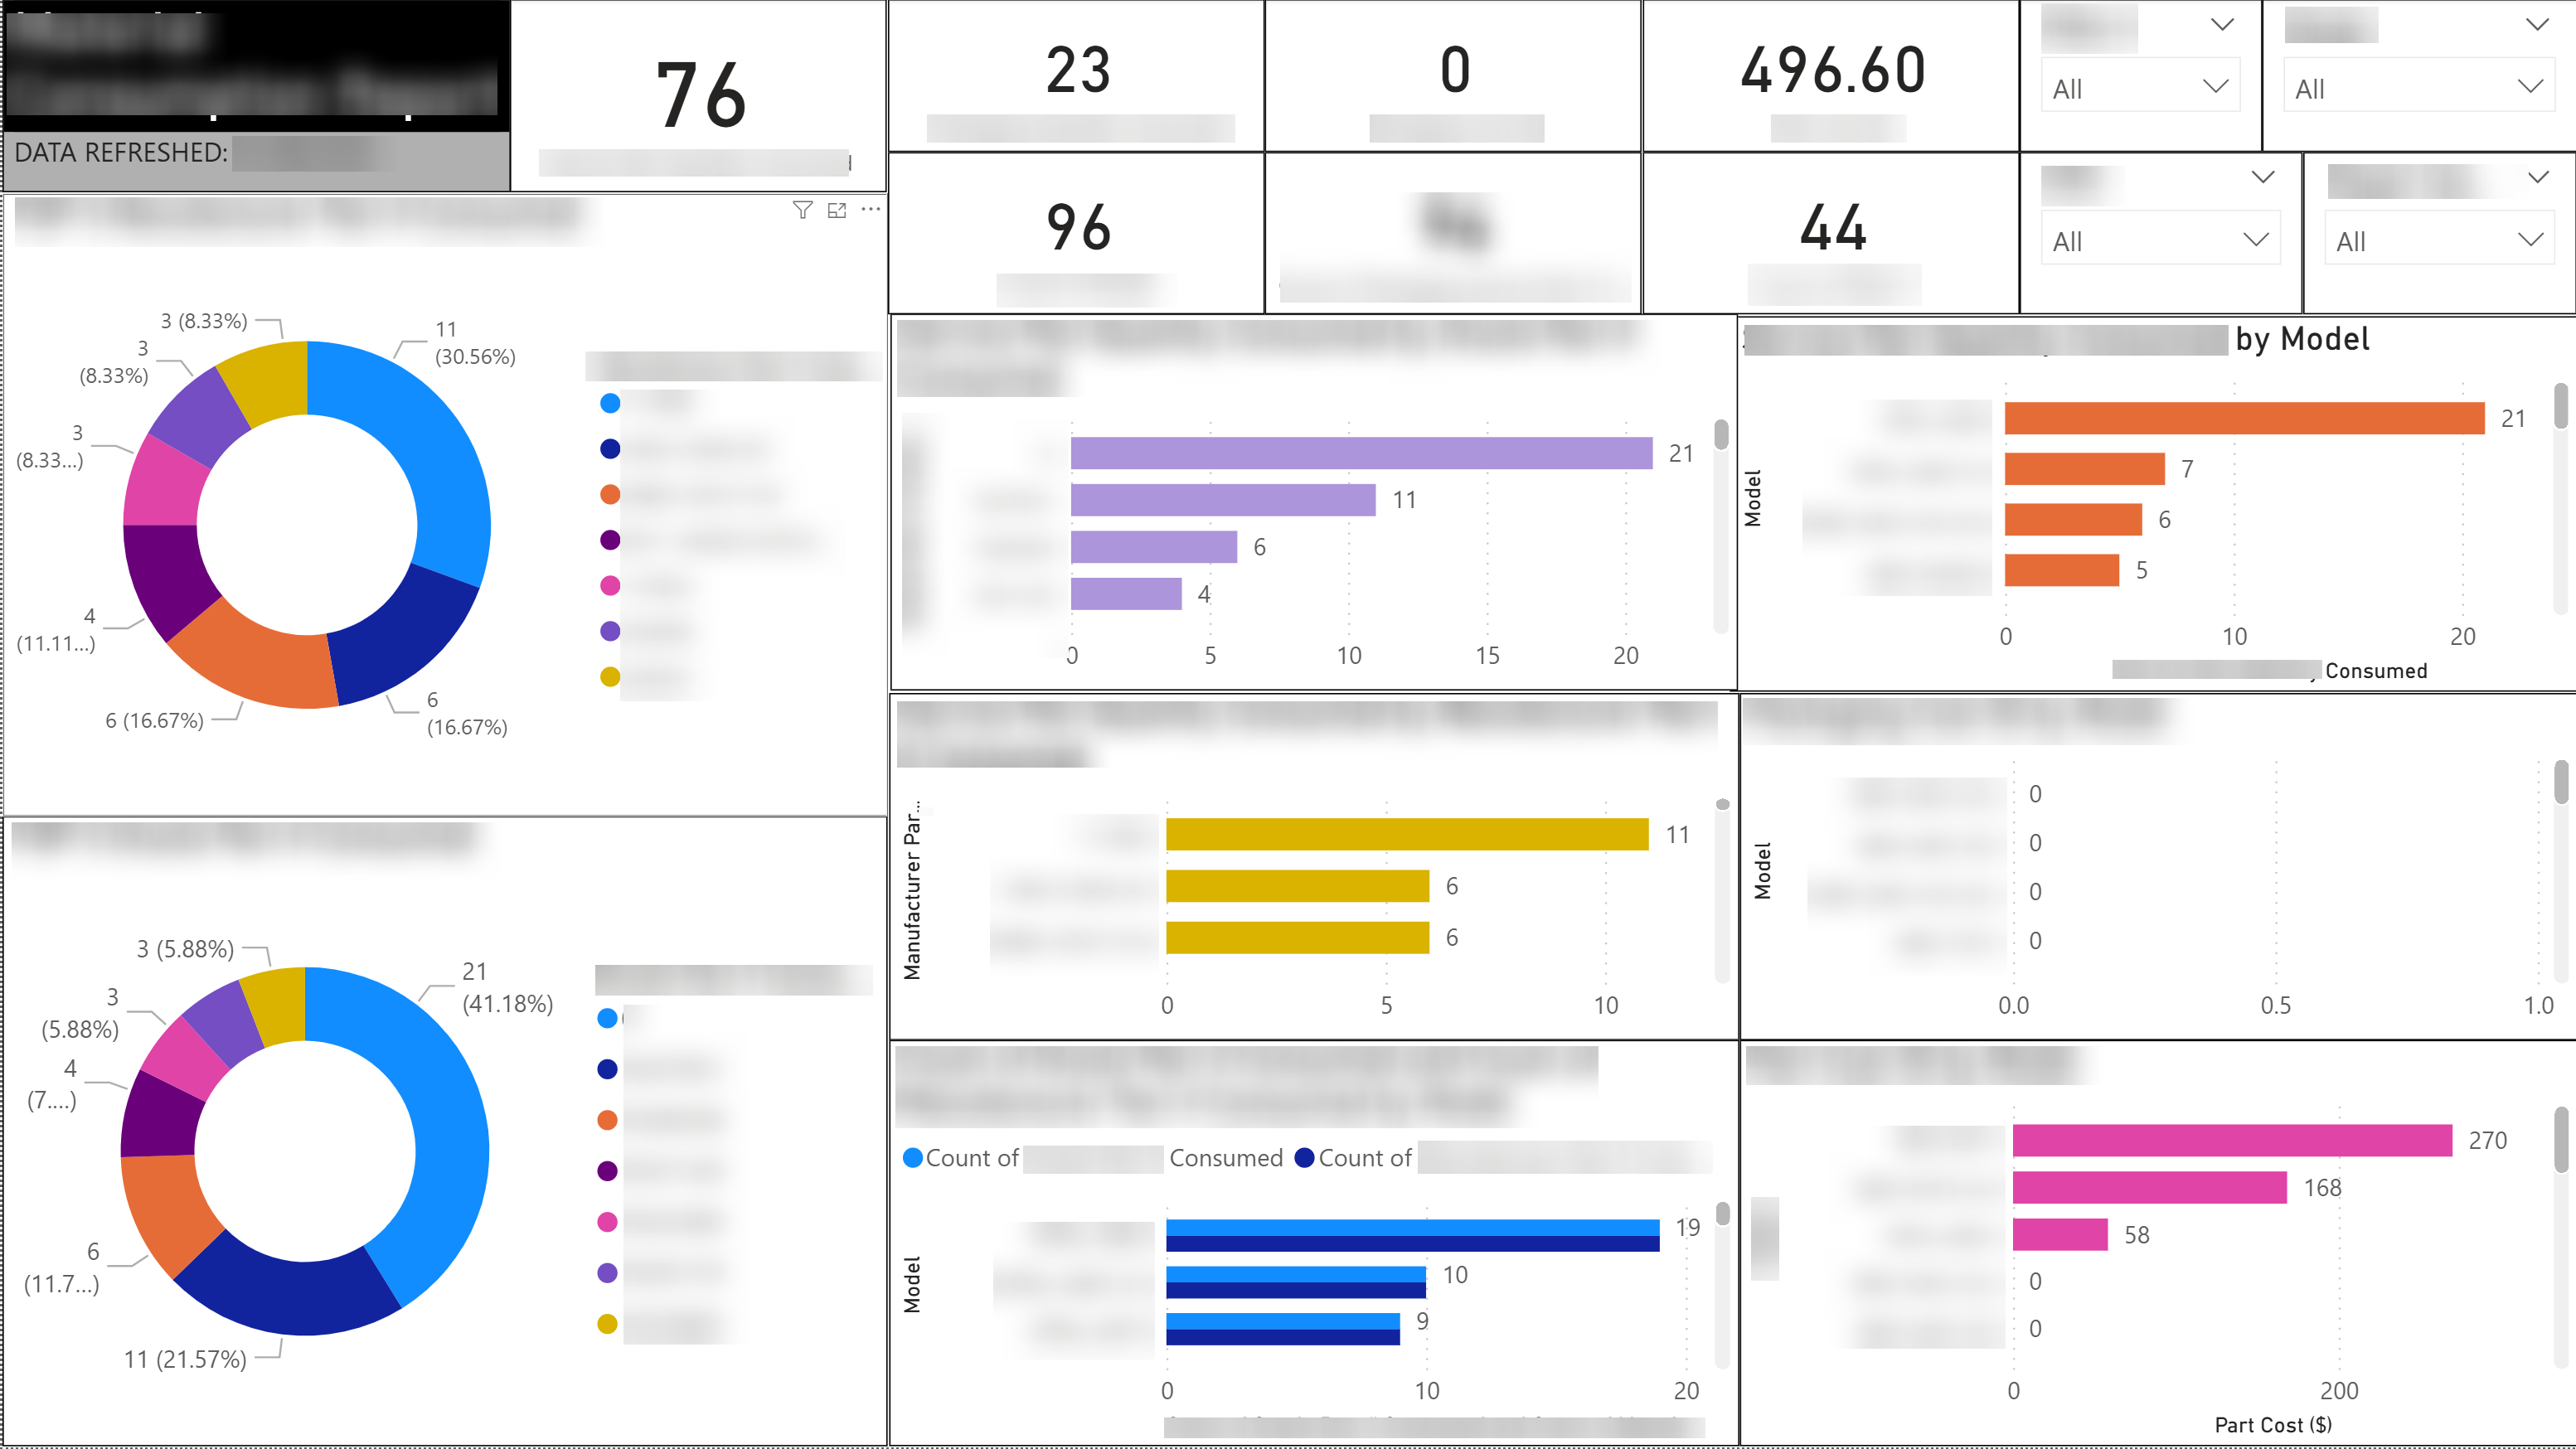
Designed and built automated data pipeline replacing manual processes along side a dev team. Worked with ops stakeholders to understand requirements, communicated effectively with developers and built ETL in SQL, and created self-service Power BI dashboards.
Data & Tooling
Replaced manual Excel reporting with SQL-driven Power BI dashboards, enabling stakeholders to access consistent, decision-ready metrics without ad-hoc requests.
Approach
Cataloged all 11 manual reporting workflows and their data sources
Compiled data from multiple data sources and fed to Power BI
Developed Power BI transformations, implementing business logic previously done manually in Excel
Created Power BI dashboards replacing static reports with interactive analysis
Outcome
80% reduction in manual reporting time; eliminating data errors
Reduced manual reporting work from 10+ hours to <2 hours per week. Eliminated data errors from manual processes. Reports made available in real-time instead of day-old data. Ops team refocused time on strategic work.
Visuals
What I'd Do Differently
Should have automated incrementally rather than attempting all 11 workflows at once—created too much change too fast, making a steeper learning curve. Also learned the importance of over-communicating during migration from manual to automated processes.